Graphite is awesome. The variety of metrics that you can put in it and the ability to build graphs to visualize specific things is an invaluable tool. However, most of the time, I just want to be able to do a quick glance at a few key things on a server like CPU usage, memory usage, disk I/O, and network traffic. While it's easy to bring these graphs up individually, in the default Graphite web UI, it's a bit harder to flip through several different server metrics quickly. Not to mention getting them in the particular way you want to view them.
At this point, you want to build a DevOps dashboard and there's a ton of choices to choose from that goes way beyond the capabilities of the default Graphite web UI. Although, you still end up with the problem of building a dashboard for each host and I have 200+ nodes. Sure, I could write a script to do it but why repeat myself when Puppet could do this for me.
I just needed to find a Graphite dashboard that I could easily model in Puppet via config files. Originally, I looked at Gdash by @ripienaar. It implements a simple DSL for Graphite that I could have easily modeled in Puppet templates but I just so happened upon the following tweet.
New GDash inspired dashboard for Graphite http://t.co/8AJEZX1Jvl from @juliendehee
— R.I.Pienaar (@ripienaar) January 16, 2014@juliendehee's Leonardo dashboard for Graphite is a simple Python Flask app that hits the Graphite render API to generate graphs. Instead of a DSL language like GDash it uses YAML files. At this point, I was positive someone had already written a Puppet type for YAML. So, I went looking on the Puppet Forge and sure enough Reid had already done the work for me.
https://forge.puppetlabs.com/reidmv/yamlfile
A few hours of hacking later and I had a Puppet module for Leonardo. It works exactly like the Nagios host/service pattern using exported resources.
Prerequisites
- Your Puppet Masters need to be using PuppetDB.
- You need to install a recent version of Puppet (>= 3.4.x) with Future parser enabled
Installation
To get started you need to add the leonardo module to your Puppet masters.
puppet module install pdxcat-leonardo
Or you can download it directly from GitHub.
Leonardo server configuration
Next, you will want to install Leonardo on a webserver. Below, you can see my role::leonardo puppet class. Include this class in your leonardo servers node definition. The leonardo class installs the packages needed for Leonardo, does some basic configuration and does a git clone of the source code from GitHub [1]. You can choose to omit the Leonardo class if you want to do it differently. Also since web server configuration is usually environment specific, I'm going to omit it from this blog post but here is an example for setting it up with Apache in the test/init.pp file using the puppetlabs/apache module [2].
The key lines to understand in this code snippet is the "mothership" operators also called exported resource collectors [3]. Lines 15-17 will collect all the leonardo resources that we are going to export on our target nodes. Then whenever the leonardo server checks in with Puppet it will ensure that all leonardo resources are created.
Leonardo client configuration
For the target node configuration we need to export resources. The following code snippet contains an example of role::leonardo::client. Include the role::leonardo::client class on every node that you want a dashboard for.
In this particular example, we are exporting a leonardo dashboard file, a directory for each server to hold the graphs, and a CPU graph. Check out the link at the bottom for our current list of graphs that we export on all nodes [4]. It should be a good starting point for getting the more common graphs up and running.
Graphs and Profit!
After running Puppet on both the target node and the Leonardo server, you should see a servers dropdown menu. Upon selecting a server from the list you should see something similar to the dashboard below.
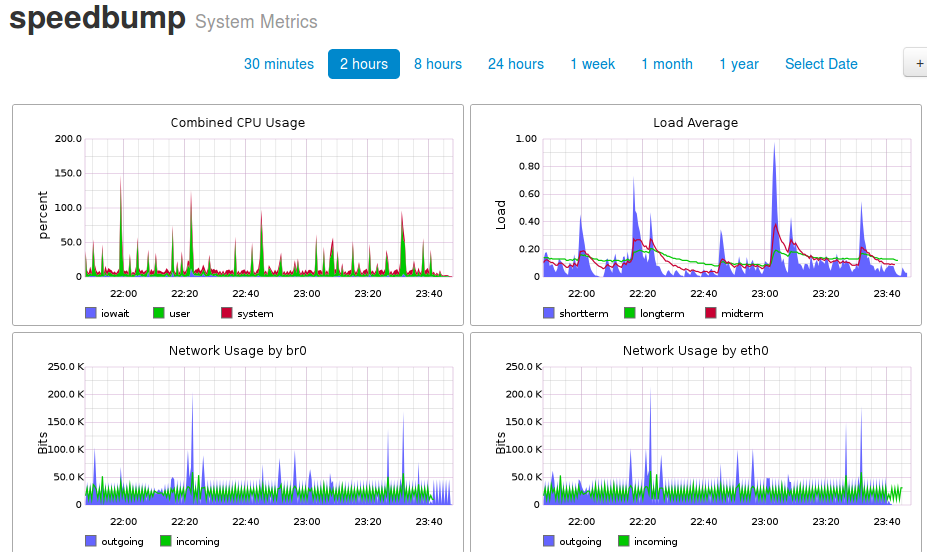
Once you're confident that you have the graphs you want defined in Puppet and have tested on one node. Include the leonardo client class on all your nodes and watch as it creates a dashboard for each server as Puppet nodes start to check in and Puppet runs on your Leonardo server.
Role Based Graphs
Now that we have a bunch of graphs that should be displayed for each node we can start adding ones for specific roles. Similar to the way you might export Nagios service checks depending on a Puppet class we can do the same with exporting leonardo dashboard resources.
Let's say we have an OpenVPN role. Normally, we would have have our server configuration, monitoring, and environment specific code defined in this file so adding leonardo resources is a natural extension.
This ability is incredibly powerful because all that metadata that Puppet knows about your infrastructure via puppet classes is now available to help you build automated dashboards. You can take it a step further by exporting Graphs to role-based Dashboards. For example, a custom dashboard for an applications with graphs from the webservers, load balancers, and database servers.
Caveats
The current implement has a few issues that I'm going to gloss over in this post. Pull requests are welcome to help fix these problems.
- Removing exported resources from PuppetDB is still a bit of a challenge
- Currently, old dashboards need to be manually removed as a purge parameter has not yet been implemented
- Yamlfile can be really slow on initial runs with a large number of hosts
Summary
TL;DR I used unreleased Puppet features to make shiny dashboards with very little effort thanks to Graphite, Collectd and Puppet.
Resources
References
- [1] At the time of writing there are no packages for Leonardo available
- [2] Installing Leonardo with Apache example puppet manifest
- [3] Docs on Exported resource collectors
- [4] Full Leonardo client example (Note: this very much a work in progress)